Version 2.7.1
Categories:
Version 2.7.1 (build 162) - NOT YET RELEASED
This release is scheduled for later in September. A release candidate will be available in a few days, and I request that users download and test it prior to the official release.
Currently, there are no plans to add any macOS Tahoe 26-specific features, such as Liquid Glass properties for buttons. The next version will be compiled with Xcode 26 on macOS Tahoe 26 and will adapt any default UI settings by the running version of macOS. However, there may be some macOS Tahoe 26-specific properties in future version 2.7.x of RsyncUI.
Some issues about default rsync version in macOS
The default version of rsync in macOS is openrsync. There are some issues with this version and RsyncUI. Please refer to the blog post Rsync versions.
Adjusting output from rsync
This application is applicable only to rsync version 3.x.
The last 16 rows for rsync version 3.x provide a summarized status of the task. The progress bar accurately reflects the current number of rows being processed during the rsync operation. The maximum number of files to be synchronized is in this version adjusted.
If there are five files to be transferred, the total number of output lines generated by rsync will be 5 + 16 = 21. After adjusting the progress bar’s maximum size to 5, the counting of files is halted when the start of status lines is detected. This causes rsync to only count the actual synchronization of files.
The above makes the progress bar more accurate.
Restrictions with openrsync
Version 2.7.1 of RsyncUI will impose certain restrictions on the operations permitted when using the default version of rsync in macOS. These restrictions will only permit standard synchronization tasks and will prohibit snapshot or syncremote tasks.
The adjustment of output is not applicable for openrsync.
Some observations about macOS Tahoe 26
Update 9 September: Apple has released release candidates (RC1) for macOS Tahoe 26 and Xcode 26, but the issue below remains unresolved. Hopefully Apple will fix the issues before the public release of macOS Tahoe 26.
One of my Macs is currently installed and updated with the latest developer release of macOS Tahoe. However, there are still some minor, non-critical bugs with RsyncUI on macOS 26. Specifically, the color of the charts is not displayed as expected, and plurals are not handled correctly. On macOS Sequoia 15.x, plurals are displayed correctly and colors in the charts.
Swift handles plurals by applying the inflect keyword.
.confirmationDialog("Delete ^[\(selectedloguuids.count) log](inflect: true)",
                                    isPresented: $confirmdelete)
                {
                    Button("Delete", role: .destructive) {
                        deletelogs(selectedloguuids)
                    }
                }
In Log listings view, as an example, selection two logs for delete. On macOS Tahoe 26, pop ups a dialog like Delete ^[2 log](inflect: true) which should be Delete 2 logs. I assume these bugs will be fixed before release of the new macOS.
Charts
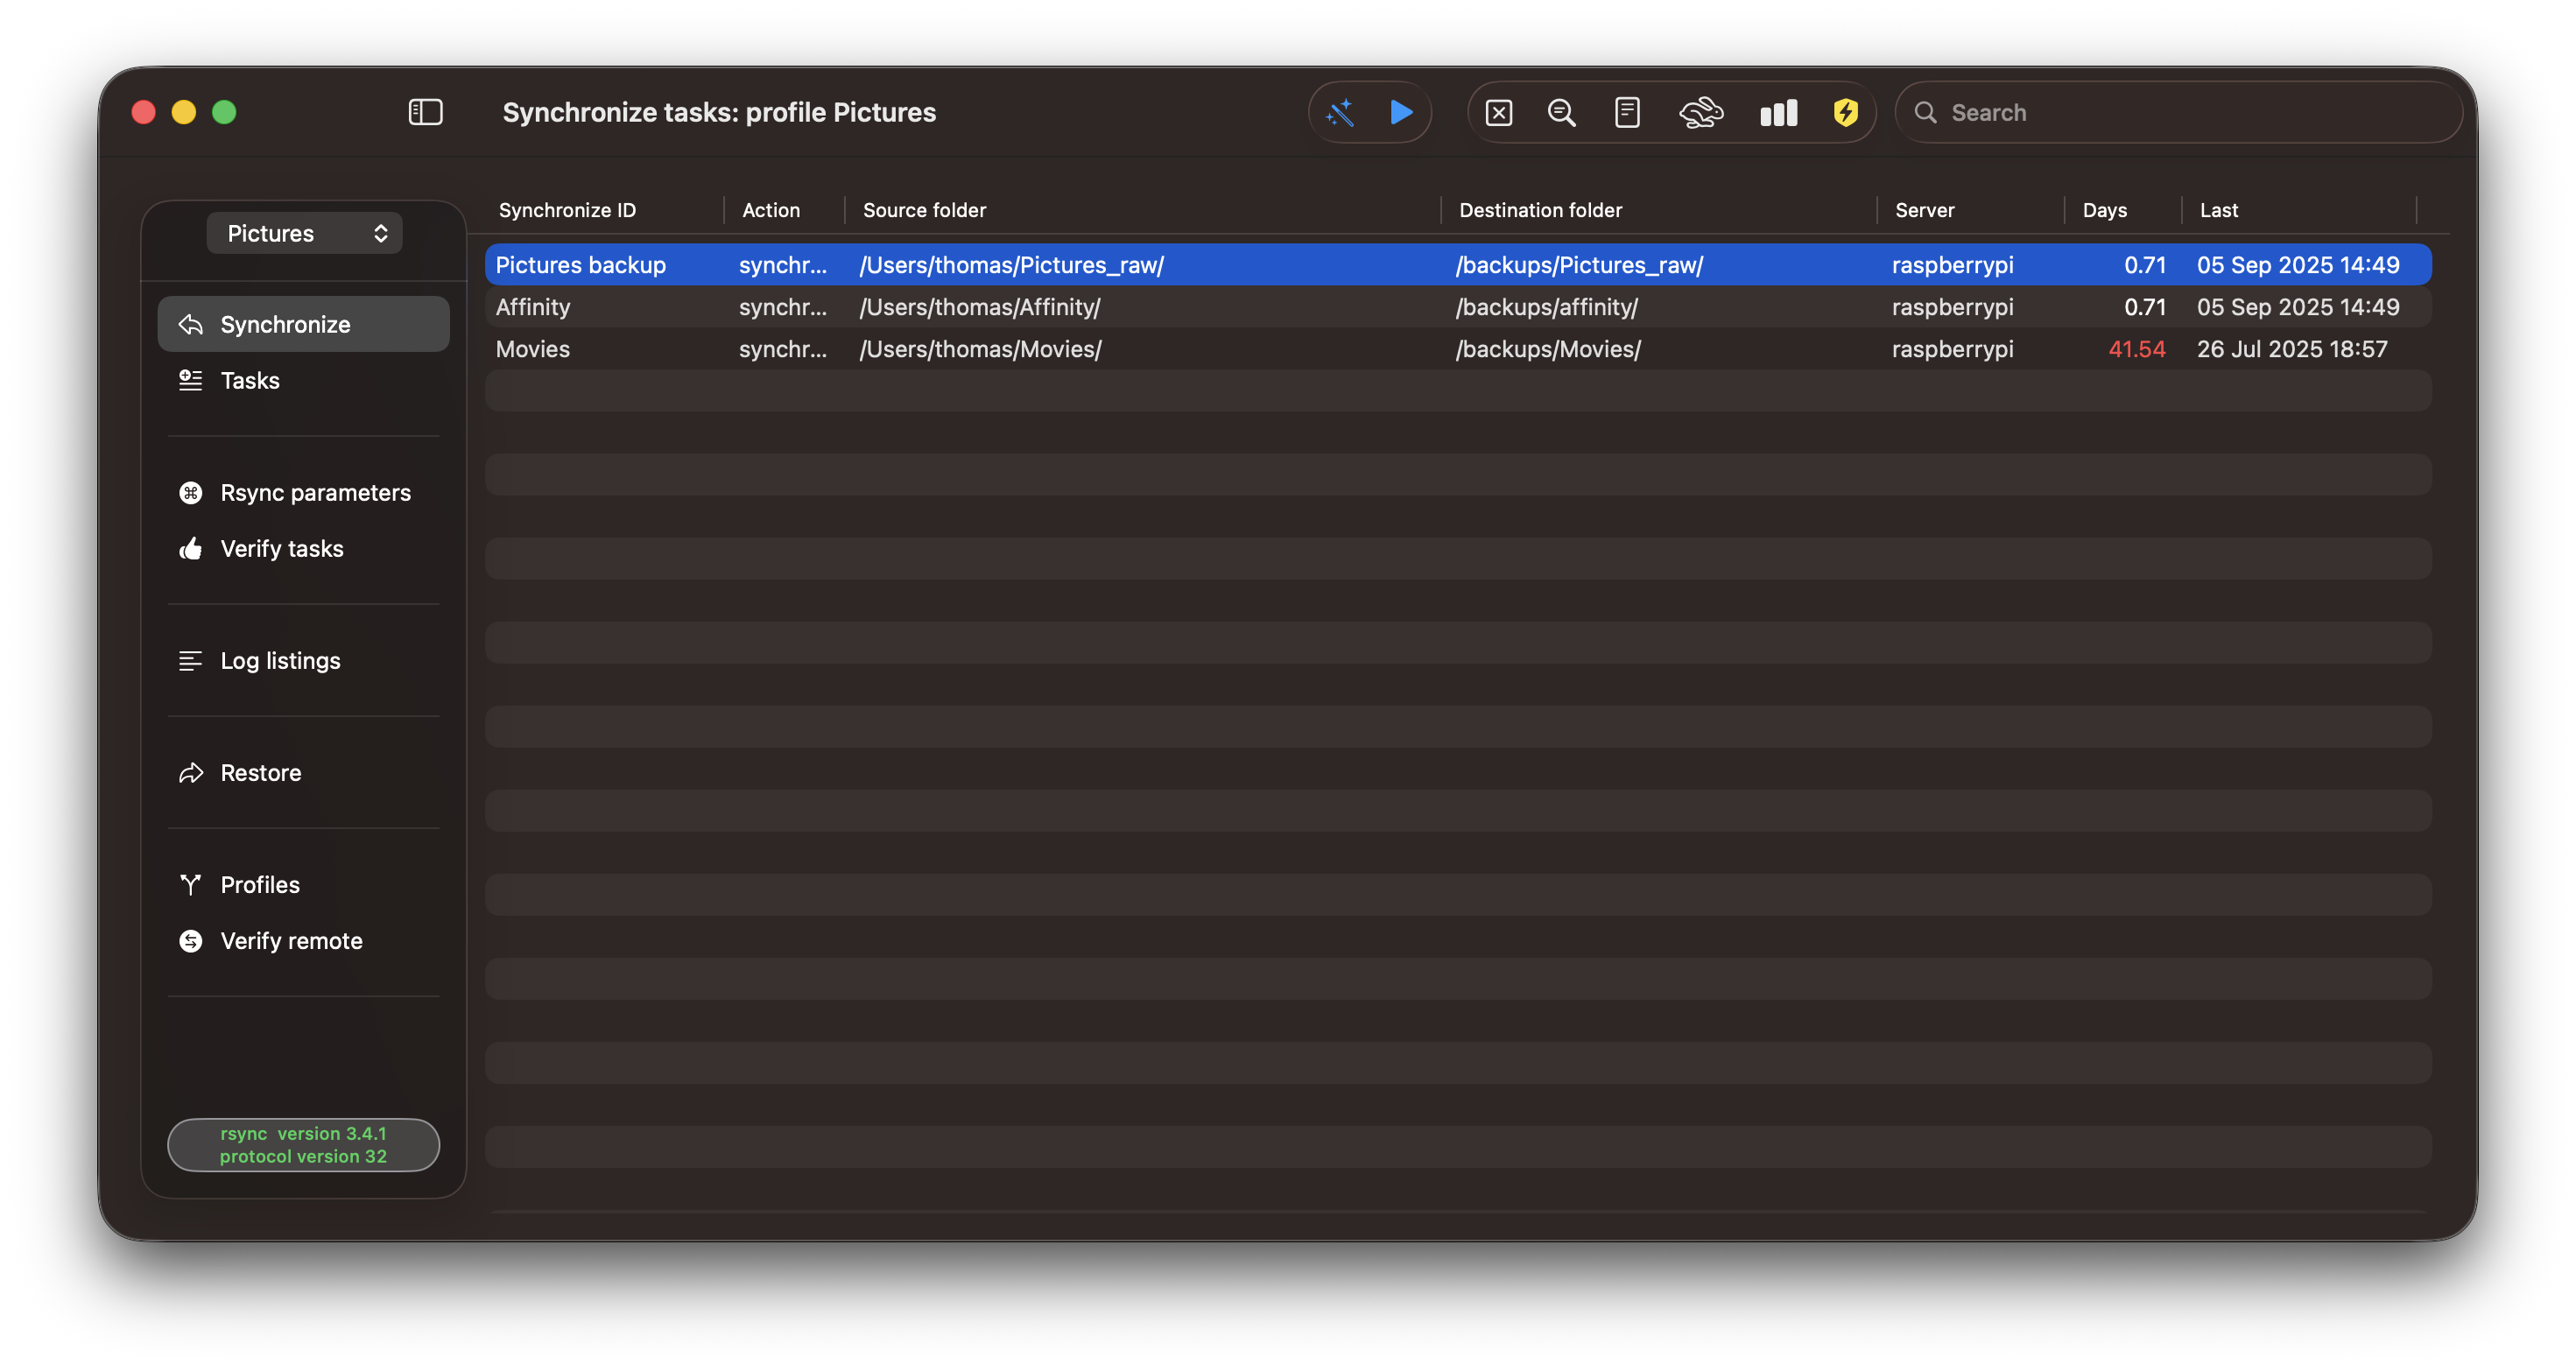
The log records generated by RsyncUI provide detailed information about file transfers, including the date, number of files transferred, and the total data transferred in megabytes (MB). All numerical data extracted from the log records is derived from the output of the rsync command.
While it is uncertain whether any charts of this data are of interest, I have begun testing data extraction and presenting some charts. As development is still in its early stages, I welcome any ideas you may have. Please feel free to contact me via email thomeven@gmail.com.
I utilize RsyncUI on a daily basis to secure data changes and updates, including development and photographic files, by backing them up externally. The parsing of log records extracts only one record per day, either based on the maximum number of files or the maximum transferred size.
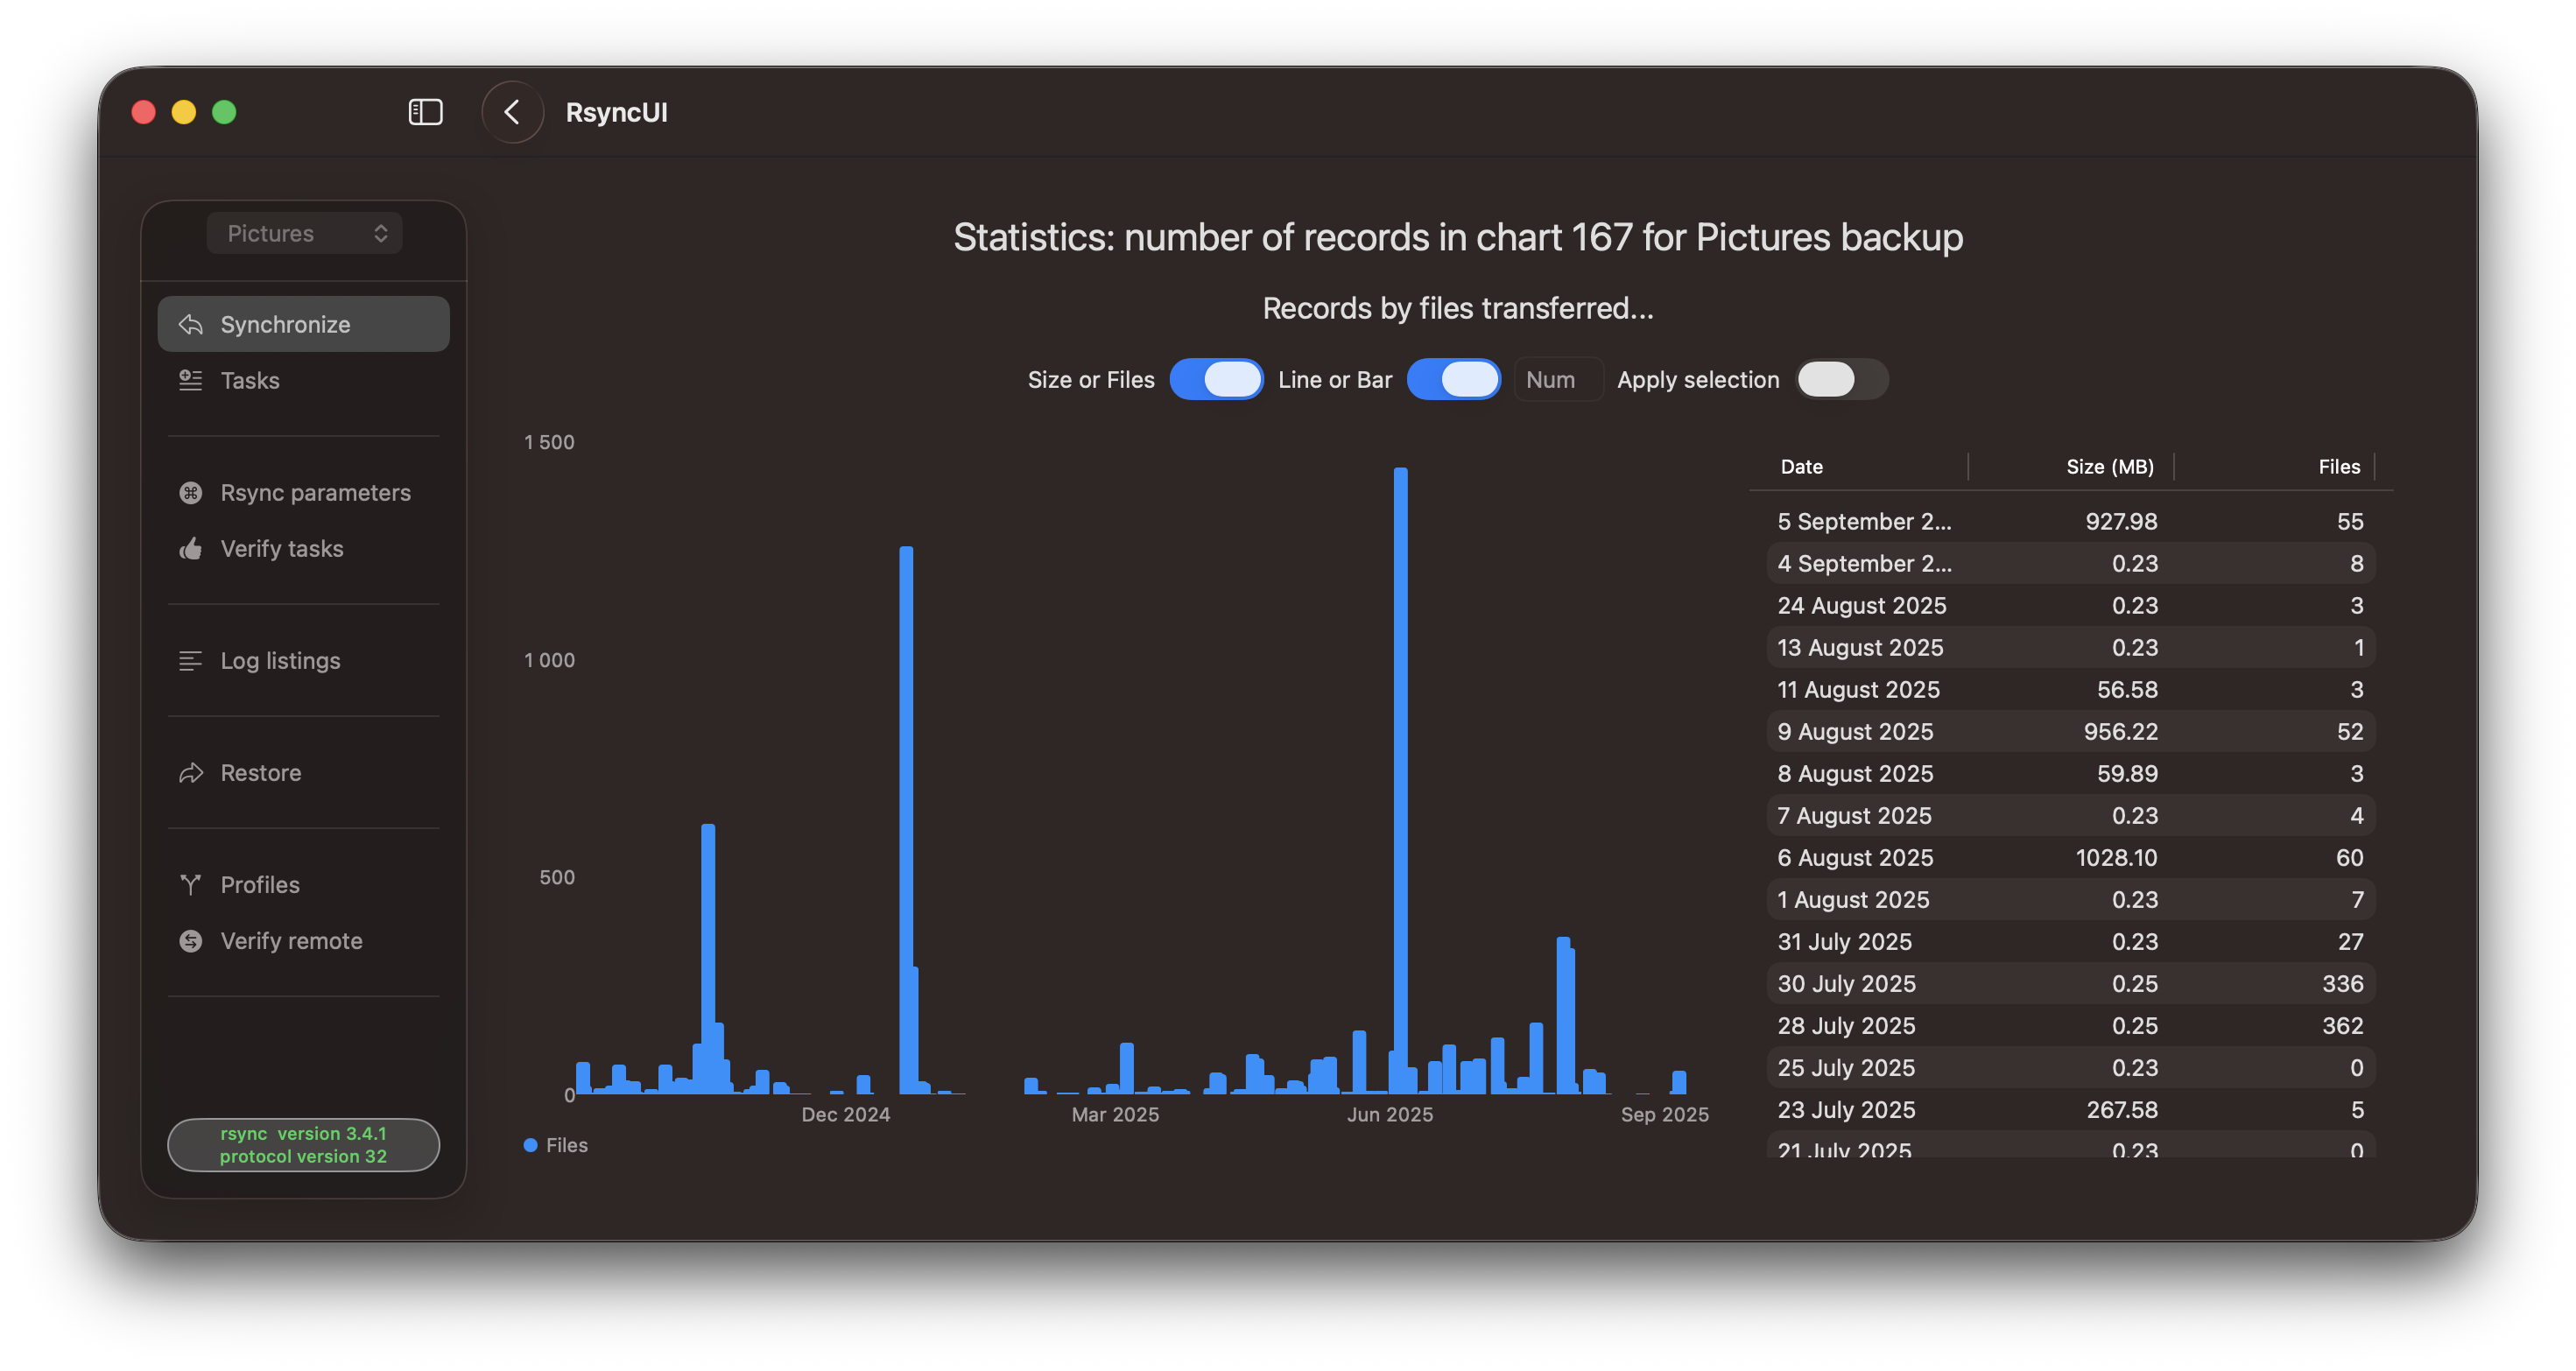
You can also configure the number of records to display in the chart. For instance, if you have approximately 500 log records and set the number to 10, the chart data selects the 10 dates with the highest data volume, either in terms of the number of files or the maximum transferred data.
Bar chart by number of files.
Bar chart by size of transfer.