Version 2.7.0
Categories:
Version 2.7.0 (build 161) - release candidate
The next version, 2.7.x build 16x, will be released after macOS Tahoe 26 is released.
Currently, there are no plans to add any macOS Tahoe 26-specific features, such as Liquid Glass properties for buttons. The next version will be compiled with Xcode 26 on macOS Tahoe 26 and will adapt any default UI settings by the running version of macOS. However, there may be some macOS Tahoe 26-specific properties in future version 2.7.x of RsyncUI.
Charts
Development is progressing. The rc was updated September 5.
The log records generated by RsyncUI provide detailed information about file transfers, including the date, number of files transferred, and the total data transferred in megabytes (MB). All numerical data extracted from the log records is derived from the output of the rsync command.
While it is uncertain whether any charts of this data are of interest, I have begun testing data extraction and presenting some charts. As development is still in its early stages, I welcome any ideas you may have. Please feel free to contact me via email thomeven@gmail.com.
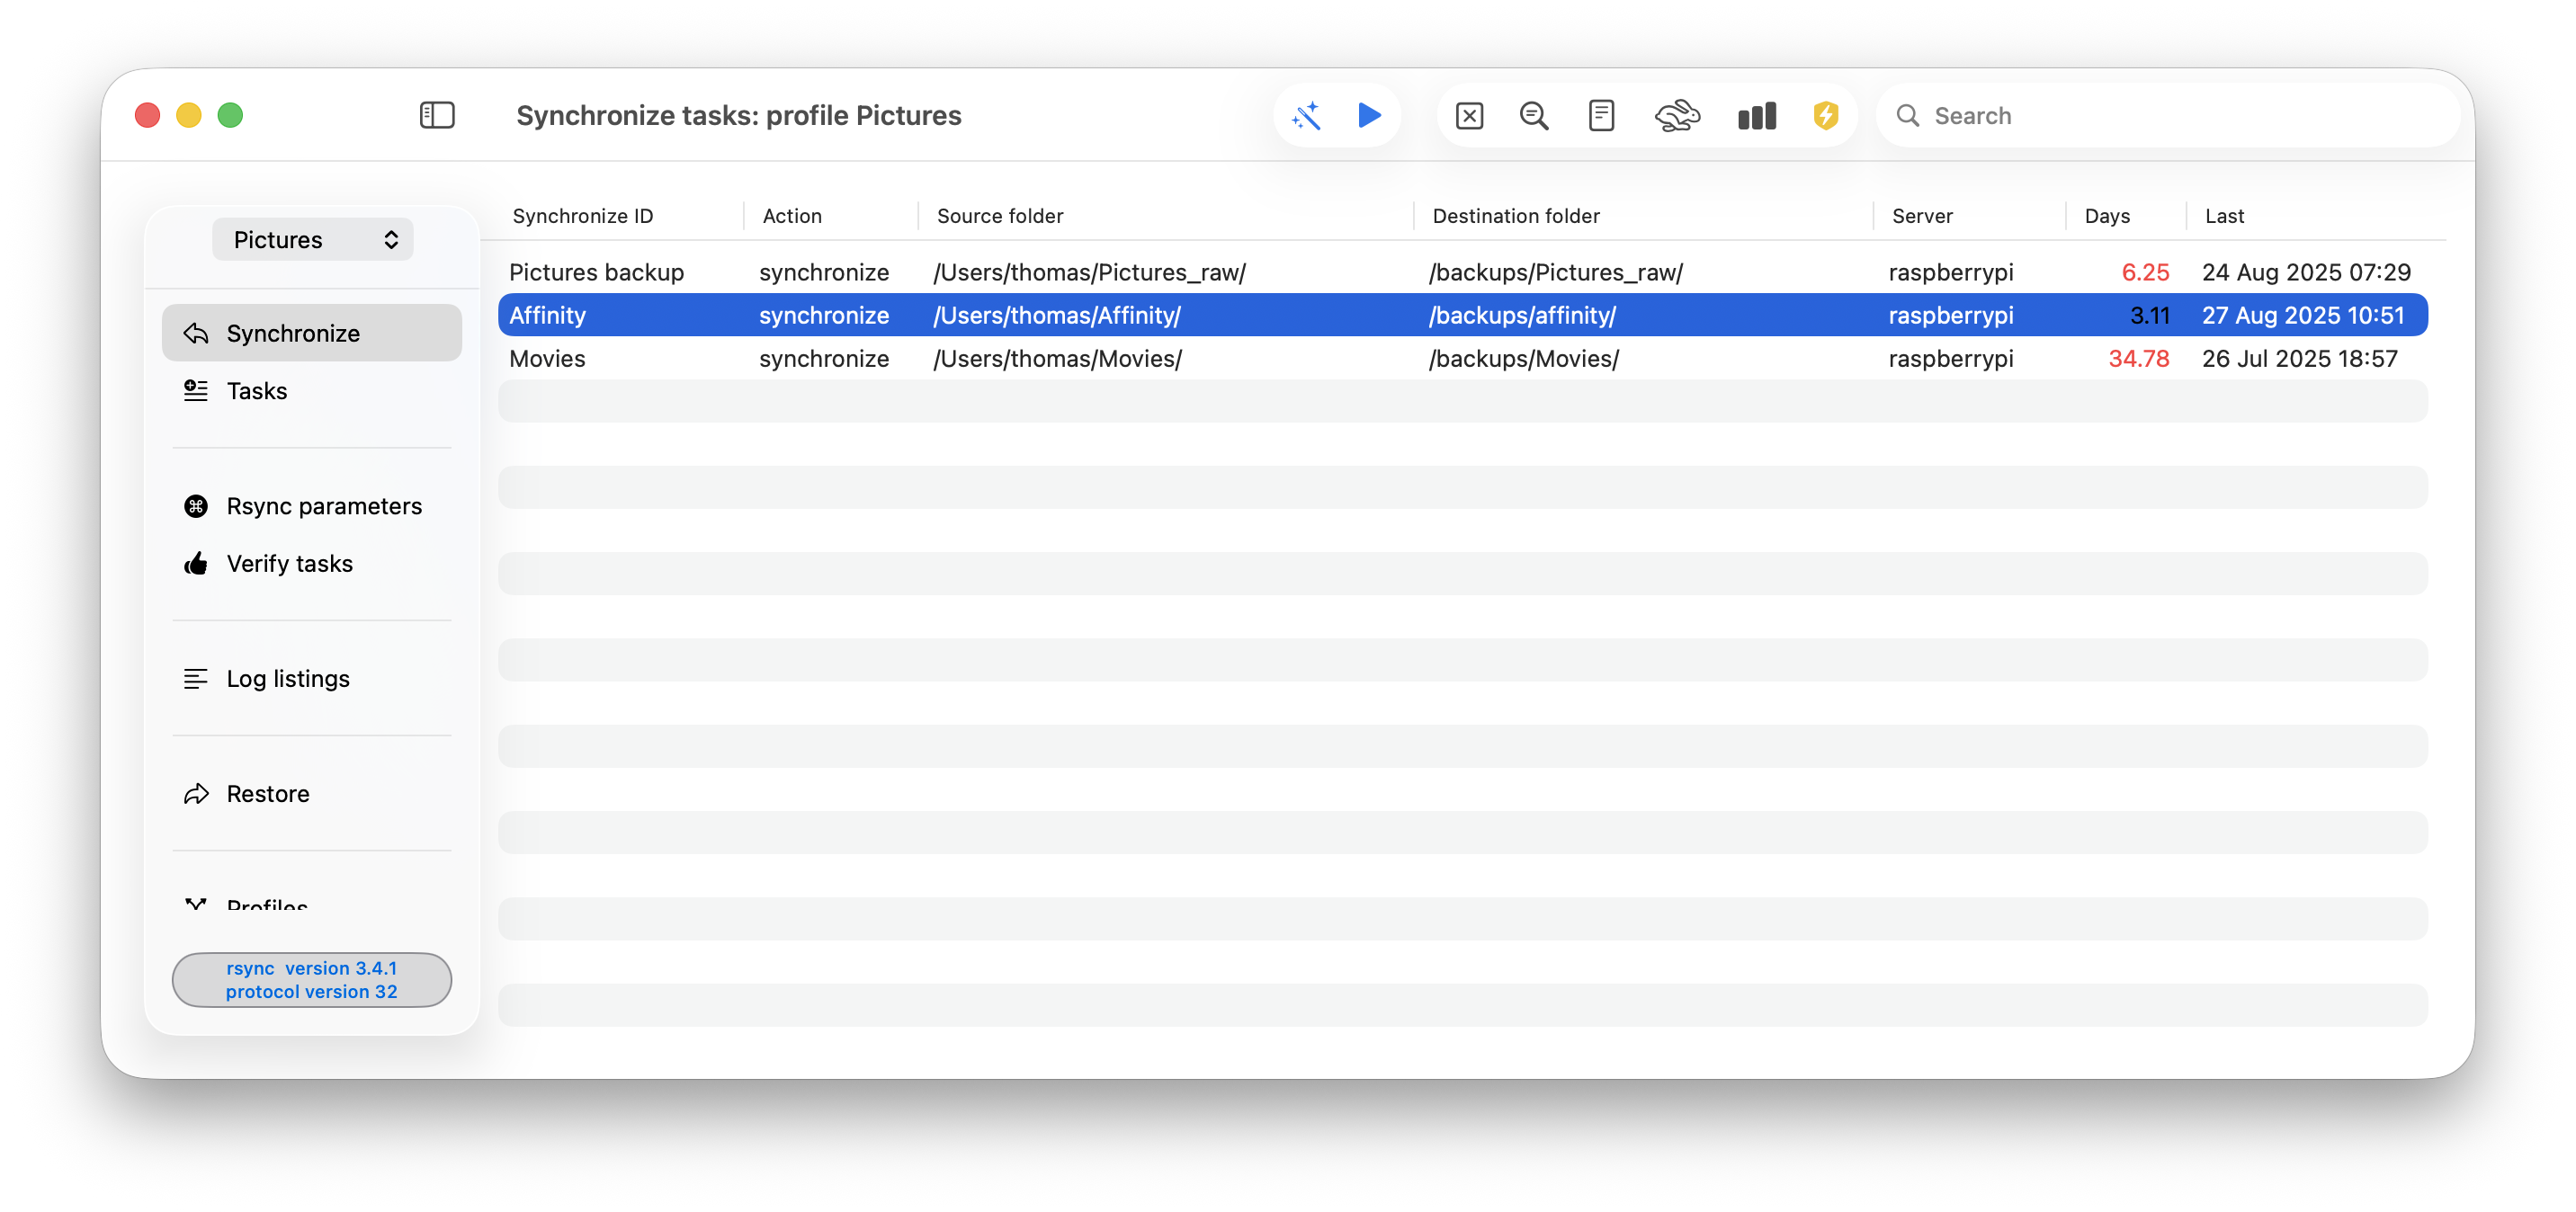
I utilize RsyncUI on a daily basis to secure data changes and updates, including development and photographic files, by backing them up externally. The parsing of log records extracts only one record per day, either based on the maximum number of files or the maximum transferred size.
You can also configure the number of records to display in the chart. For instance, if you have approximately 500 log records and set the number to 10, the chart data selects the 10 dates with the highest data volume, either in terms of the number of files or the maximum transferred data.
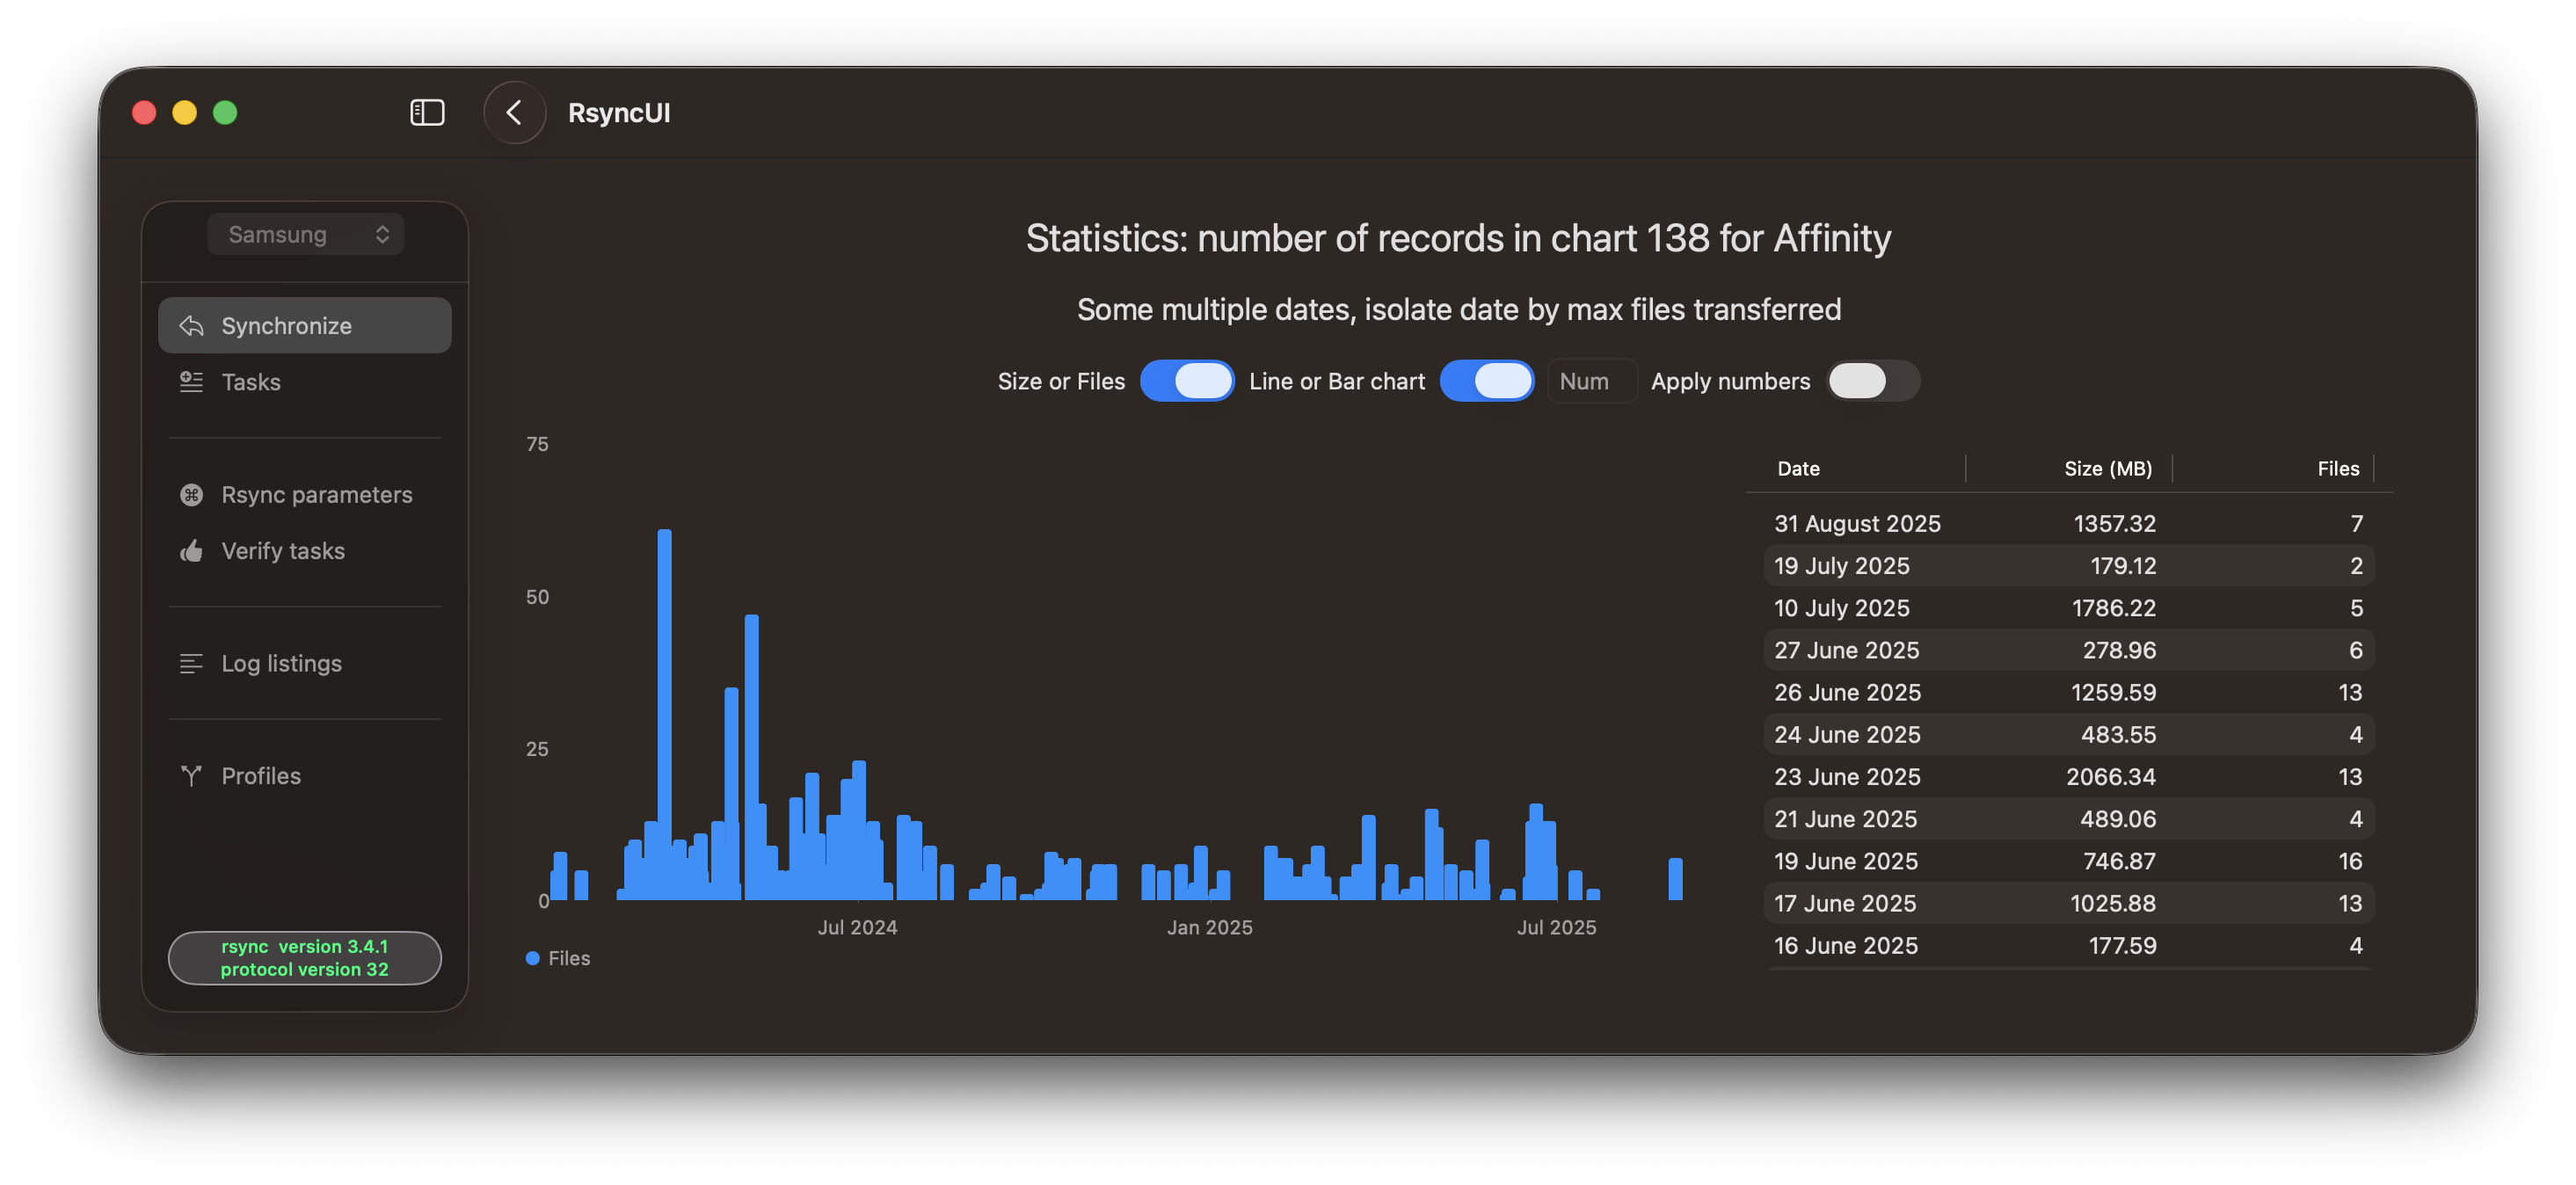
Some multiple dates, select date where number of files is greatest.
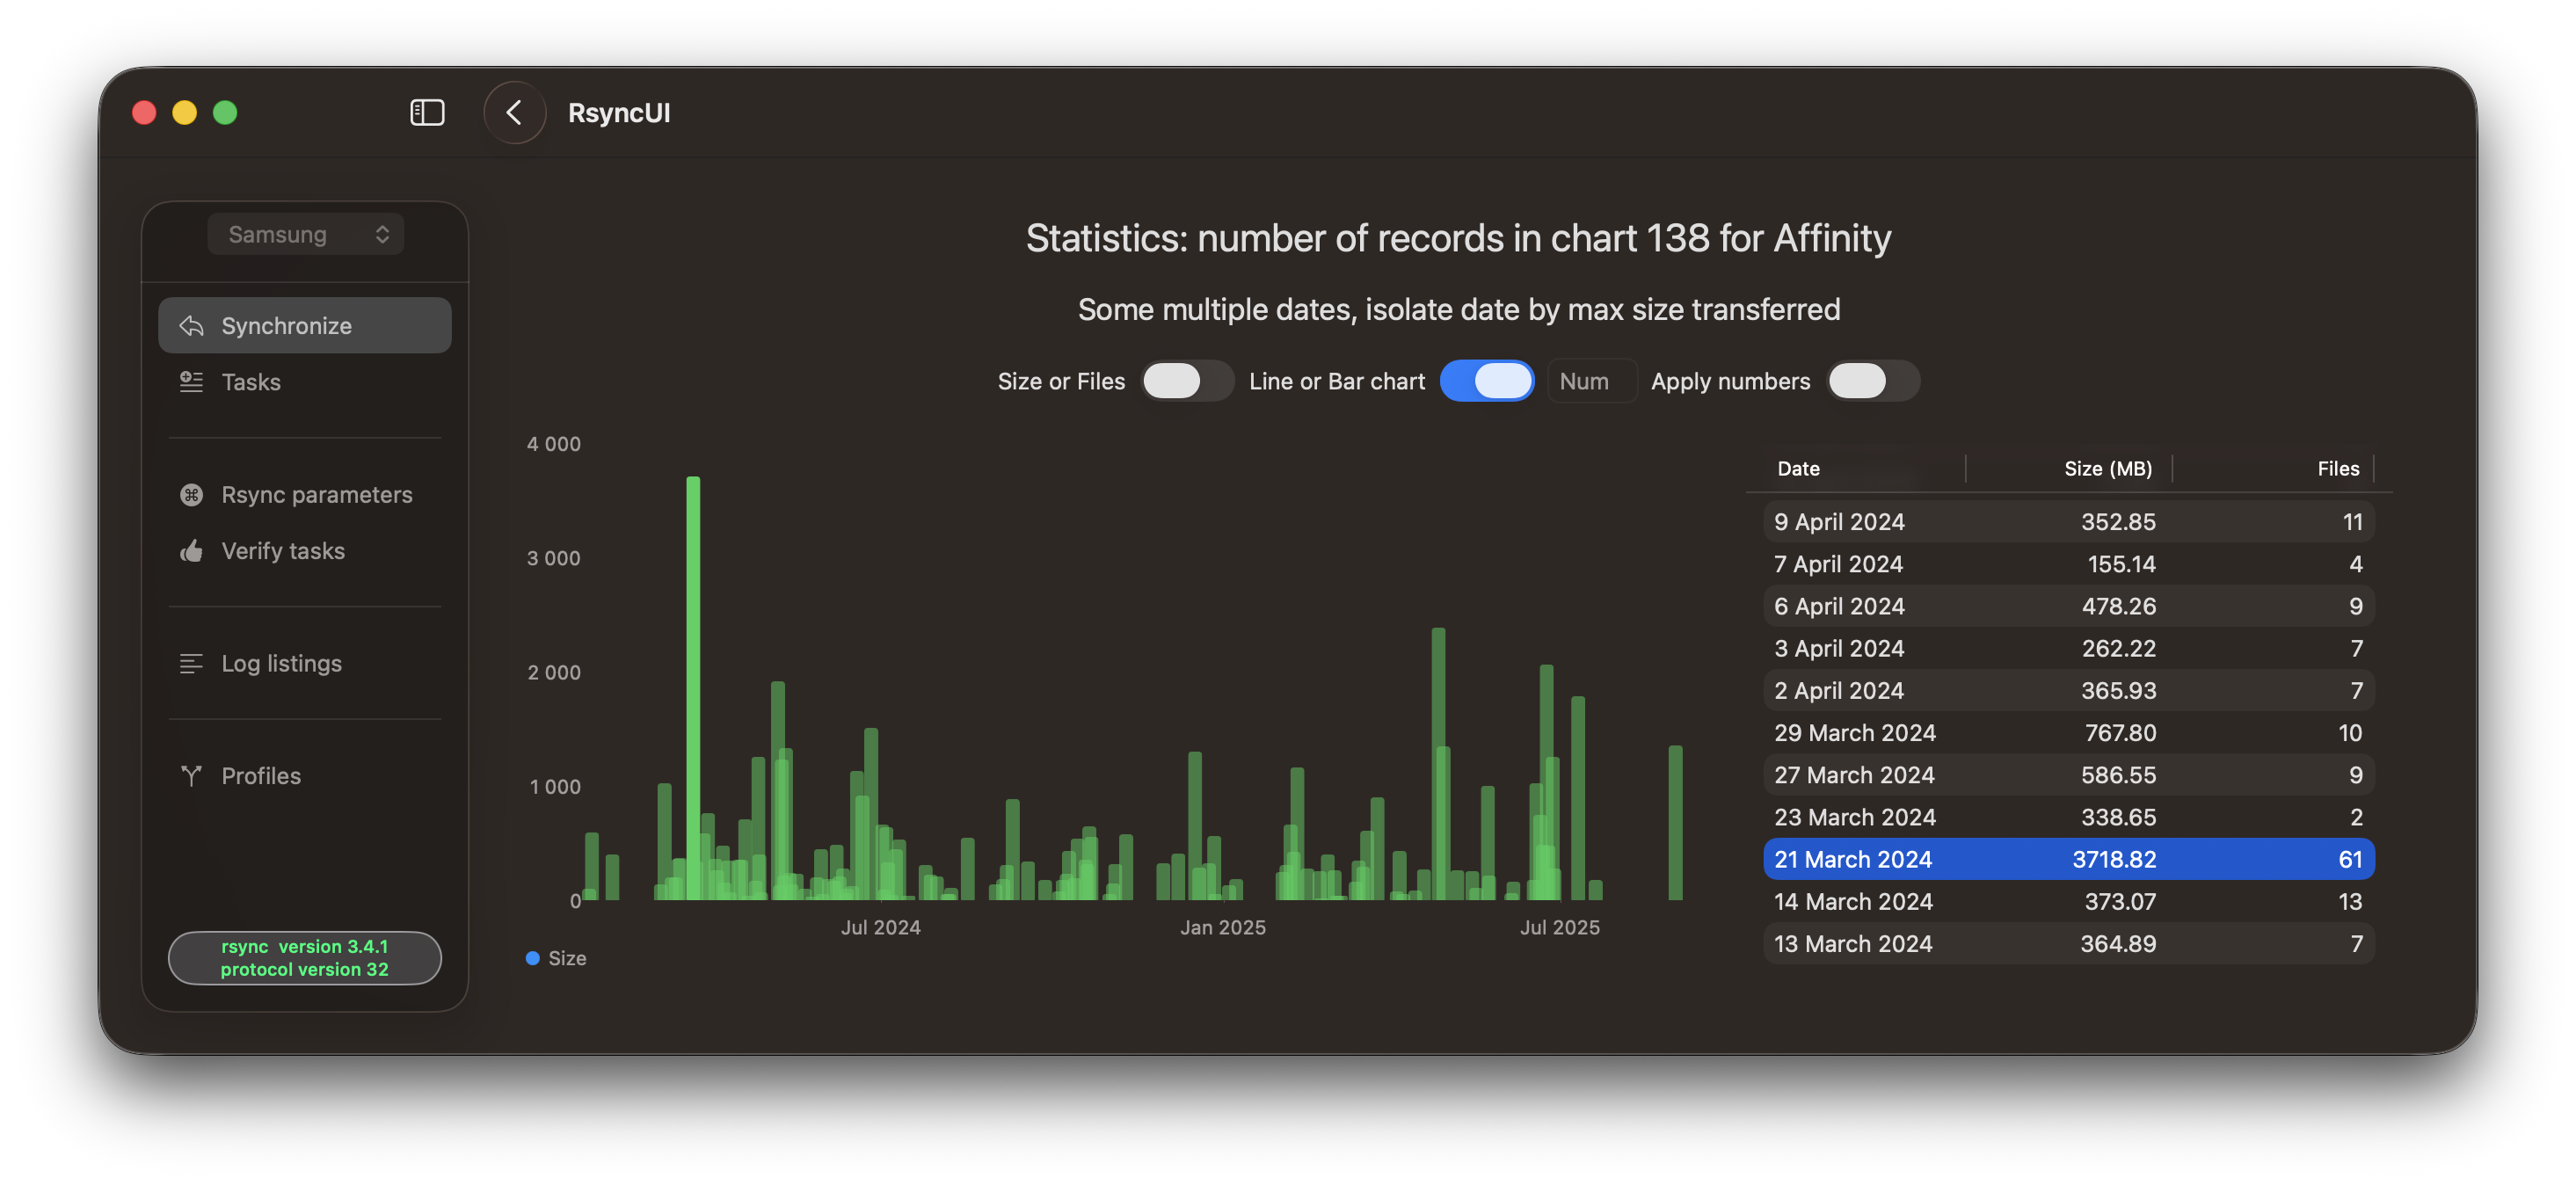
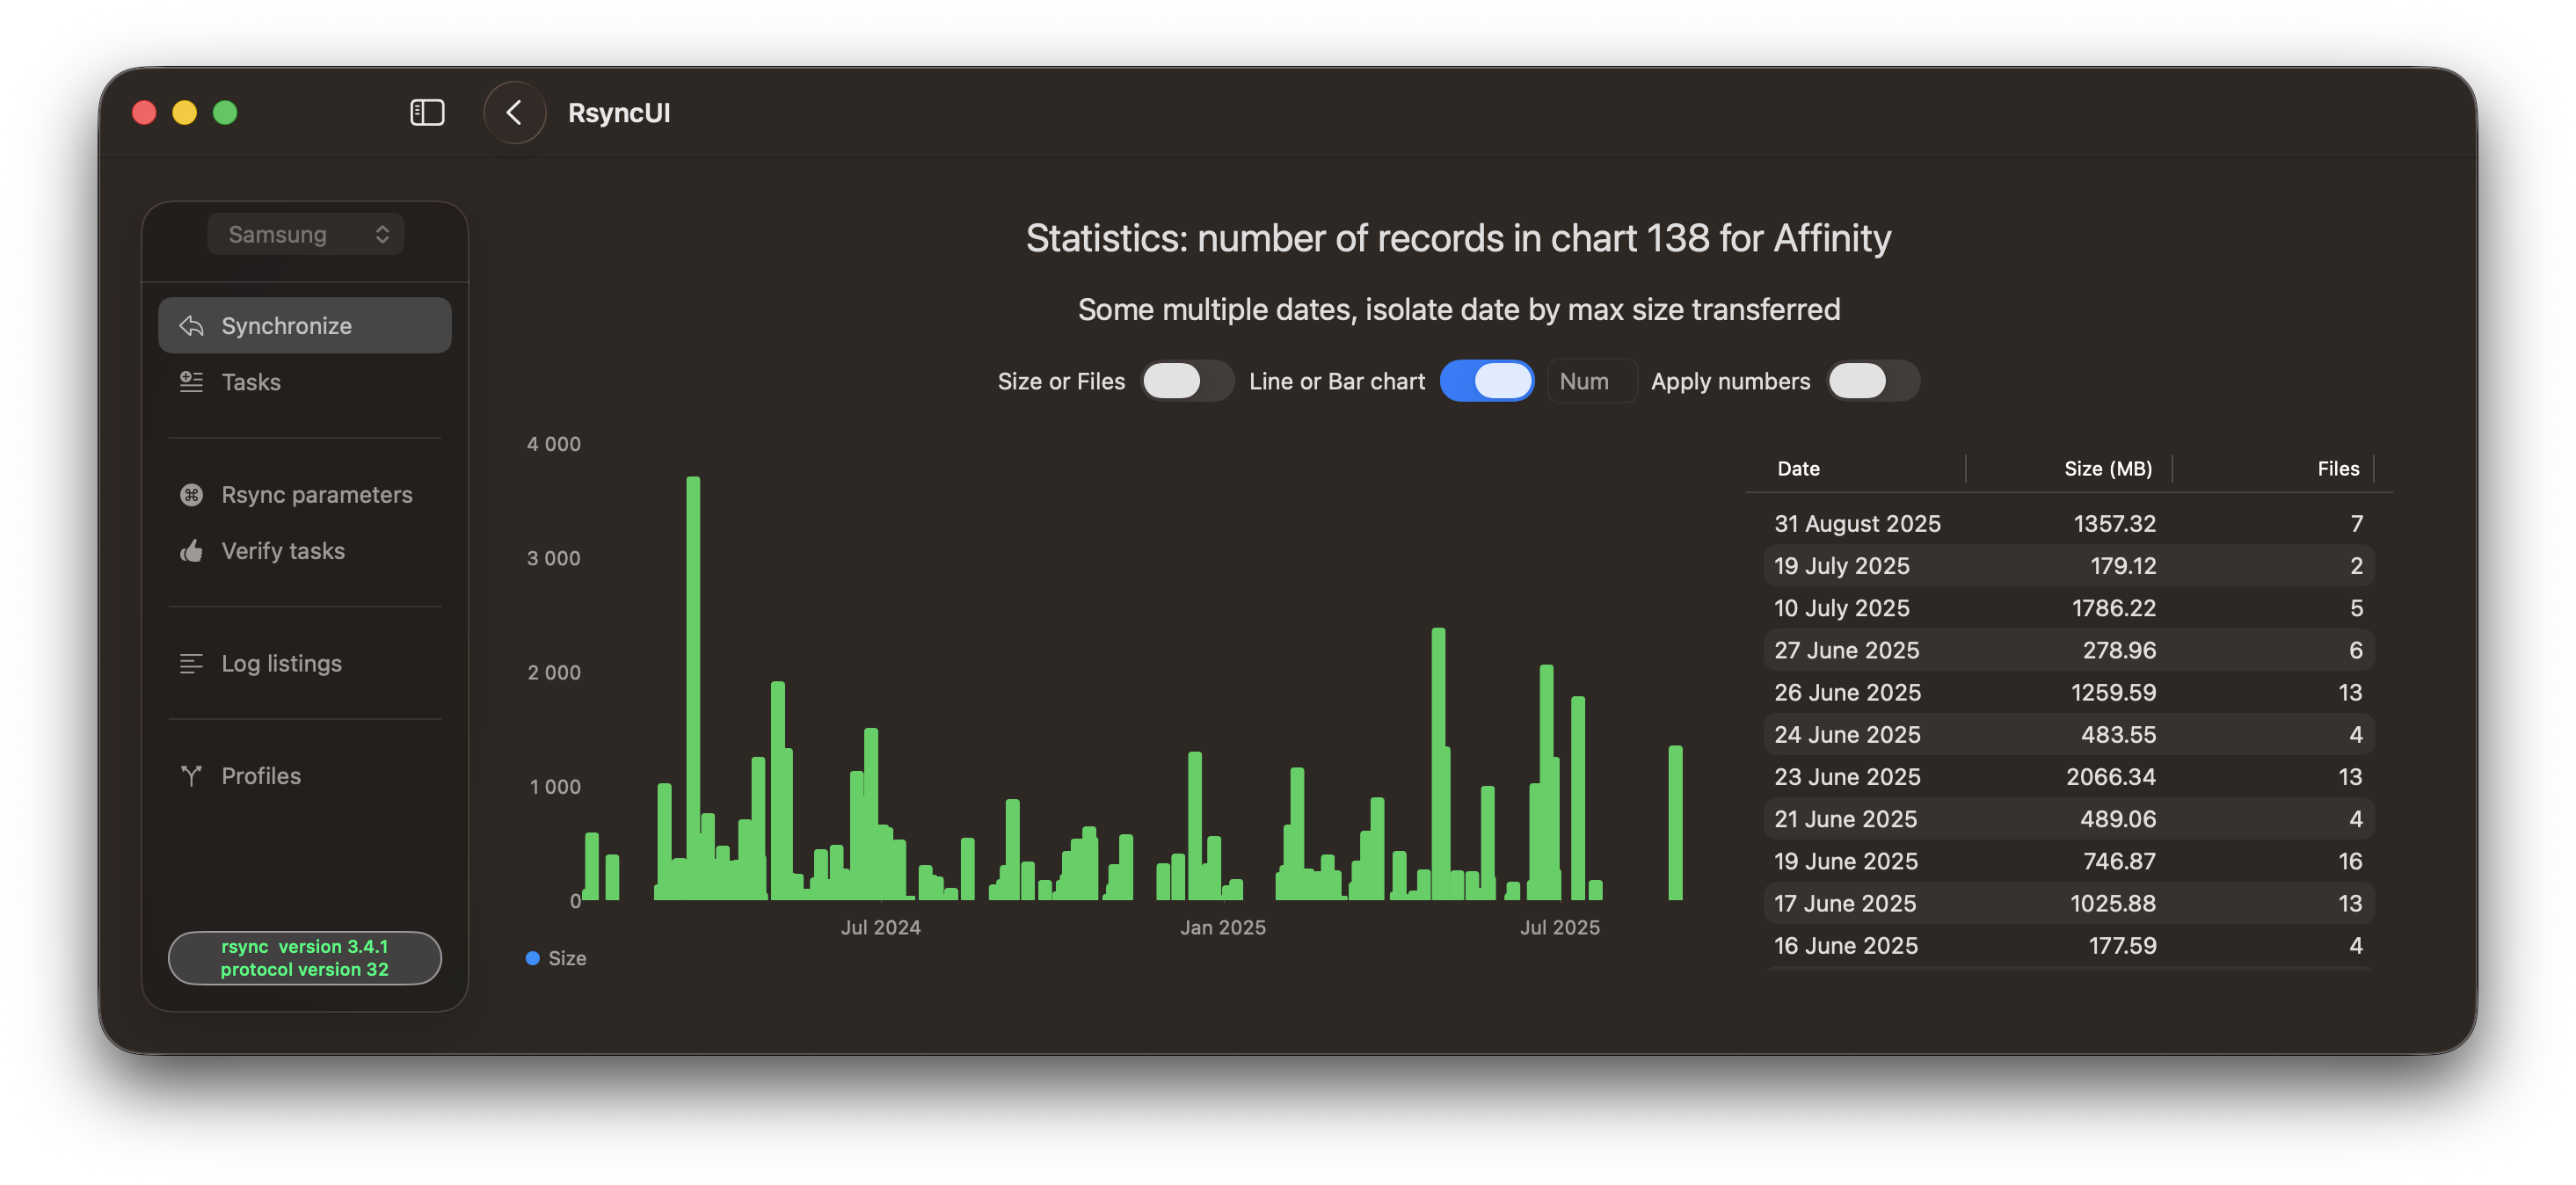
Some multiple dates, select date where size of transfer is greatest.
In bar charts, selecting a row in the data table highlights the corresponding row in the chart.